
GINTING, RANDY PRANATA (2015) ANALISA KADAR ION CU2+ YANG TERDAPAT PADA GLYSEROL DENGAN METODE SPEKTROFOTOMETRI VISIBLE (Analysis of Cu2+ on glycerol levels with spectophotometric method ). Undergraduate thesis, Undip.
![[img]](/style/images/fileicons/application_pdf.png)
| PDF (COVER) - Published Version 91Kb | |
| PDF (HALAMAN PENGESAHAN) - Published Version 97Kb | |
| PDF (KATA PENGANTAR) - Published Version 85Kb | |
| PDF (DAFTAR ISI) - Published Version 41Kb | |
| PDF (BAB I) - Published Version 177Kb | |
| PDF (BAB II) - Published Version 634Kb | |
| PDF (BAB III) - Published Version 82Kb | |
| PDF (BAB IV) - Published Version 201Kb | |
| PDF (BAB V) - Published Version 176Kb | |
| PDF (BAB VI) - Published Version Restricted to Repository staff only 281Kb | |
| PDF (BAB VII) - Published Version 86Kb | |
| PDF (DAFTAR PUSTAKA) - Published Version 85Kb | |
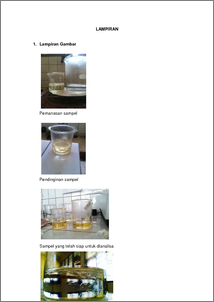
| PDF (LAMPIRAN) - Published Version 442Kb |


Abstract
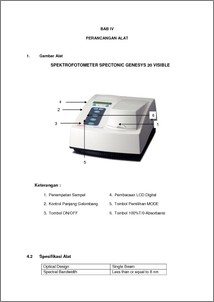
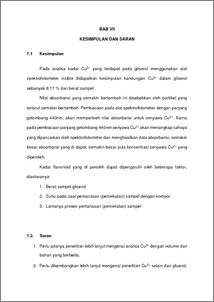
Glycerol is a major component of all fats and oils, in the form of esters called glycerides. Triglyceride molecule consists of one molecule of glycerol combined with three molecules of fatty acids. Glycerol is found to have various uses in the manufacture of various products in domestic, industrial, and pharmaceutical. Nowadays, the name refers to glycerol and commercially pure chemical compound known as glycerin. Observations absorbance values of Cu 2+ compounds can be done with a wavelength range 430-450nm using a spectrophotometer. SPECTRO is one method of instrumental analysis using the basic interaction of energy and matter. Spectro can be used to determine the concentration of a solution through absorption intensity at a particular wavelength. In the determination of Cu 2+ research using glycerol 50ppm, 60ppm, 70ppm, 80ppm, and 90ppm concentrated with mixed by HN O 3. After the concentrated cooled and tested absorbance values using Genesys 20 spectrophotometer Spectonic visible. Cu 2+ concentration calibration curve obtained from the equation y = ax + b, where y as absorbance values, and x is the value of concentration. From the calculations, the concentration of Cu 2+ on glycerol amounted to 8.172%. Keywords: Cu 2+, Glycerol, Visible spectrophotometer
| Item Type: | Thesis (Undergraduate) |
|---|---|
| Subjects: | T Technology > TP Chemical technology |
| Divisions: | Faculty of Engineering > Diploma in Chemical Engineering Faculty of Engineering > Diploma in Chemical Engineering |
| ID Code: | 47843 |
| Deposited By: | INVALID USER |
| Deposited On: | 10 Mar 2016 08:19 |
| Last Modified: | 10 Mar 2016 08:19 |
Repository Staff Only: item control page
