
Apriantoro , Nursama Her (1999) Pengaruh parameter window width dan window level terhadap perbedaan derajat Kehitaman pada citra Computed Tomografi Generasi III. Undergraduate thesis, FMIPA UNDIP.
![[img]](/style/images/fileicons/application_pdf.png) | PDF Restricted to Repository staff only 2556Kb | |
| PDF 20Kb | |
| PDF 354Kb | |
| PDF 551Kb | |
| PDF 464Kb | |
| PDF 1099Kb | |
| PDF 605Kb | |
| PDF Restricted to Repository staff only 613Kb | |
| PDF 357Kb | |
| PDF 341Kb | |
| PDF 511Kb |
Abstract
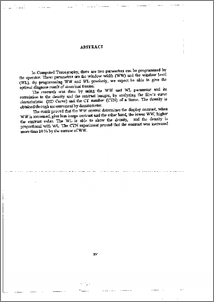
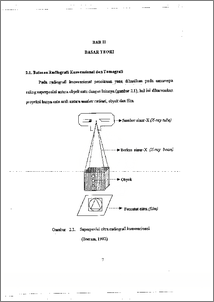
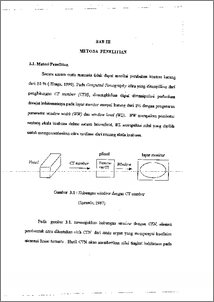
Pada Computed Tomography terdapat dua parameter yang dapat diprogram oleh operator. Parameter tersebut adalah Window Width (WWI clan Window level (WL). Dengan pemrograman WW dan WL secara tepat mampu memberikan hasil diagnosa yang optimal dari suatu jaringan yang mengandung kelainan. Penelitian dilakukan dengan menggunakan parameter WW dan WL serta hubungannya terhadap derajat kehitaman dan kontras, dengan menganalisa kurva karakteristik film (ED Curves) dan CT number (CT.IV) suatu jariugan. Derajat kehitaman diperoleh melalui pengukuran dengan densitometer.. Hasil percobaan membuktikan bahwa WW berpengaruh terhadap kontras, penambahan WW akan menghasilkan kontras yang lebih rendah dan sebaliknya pada penggunaan WW yang sempit akan menghasilkan penambahan kontras. Parameter WL menunjukan densitas, densitas mempunyai kesebandingan secara proposional dengan penibahan WL. Eksperimen CTN membuktikan adanya peningkatan kontras iebih dari 10% dengan penyempitan window width. In Computed Tomography, there are two parameters can be programmed by the operator. These parameters are the window width (WW) and the window level (WL). By programming WW and WL precisely, we expect be able to give the optimal diagnose result of abnormal tissues. The research was done by using the WW and WL parameter and its correlation to the density and the contrast images, by analyzing the film's curve characteristic (HD Curve) and the CT number (C 1'N) of a tissue. The density is obtained through measurement by densitometer. The result proved that the WW control determines the display contrast, when WW is increased, give less image contrast and the other hand, the lower WW, higher the contrast value. The WL is able to show the density, and the density is proportional with WL. The CTN experiment proved that the contrast was increased more than 10 % by the narrow of WW.
| Item Type: | Thesis (Undergraduate) |
|---|---|
| Subjects: | Q Science > QC Physics |
| Divisions: | Faculty of Science and Mathematics > Department of Physics |
| ID Code: | 30432 |
| Deposited By: | Mr UPT Perpus 1 |
| Deposited On: | 31 Oct 2011 07:57 |
| Last Modified: | 31 Oct 2011 07:57 |
Repository Staff Only: item control page
